
Labour market analysis system
Labour market data of border regions shown on maps with charts and thematic maps.
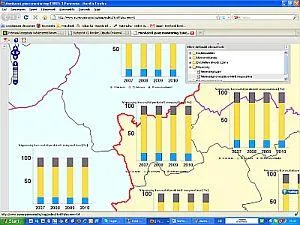
The website, built on behalf of the Employment Office (Foglalkoztatási Hivatal), shows the labour market data of the western Hungarian region and the neighbouring border regions of Austria on maps. Users can create charts and thematic coloured maps, or display the results of predefined analyses.
The results of the analyses can be saved as PDF files for later use.
Let us talk about your project
If one of our solutions interests you, or you have a special requirement, write to us or call our colleagues.
Contact